Supplemental Materials for Complexity Estimator
This page provides supplemental materials to a paper, “Model-based Data-complexity Estimator for Deep Learning Systems”. We show all results including the ones omitted from the paper due to space limit.
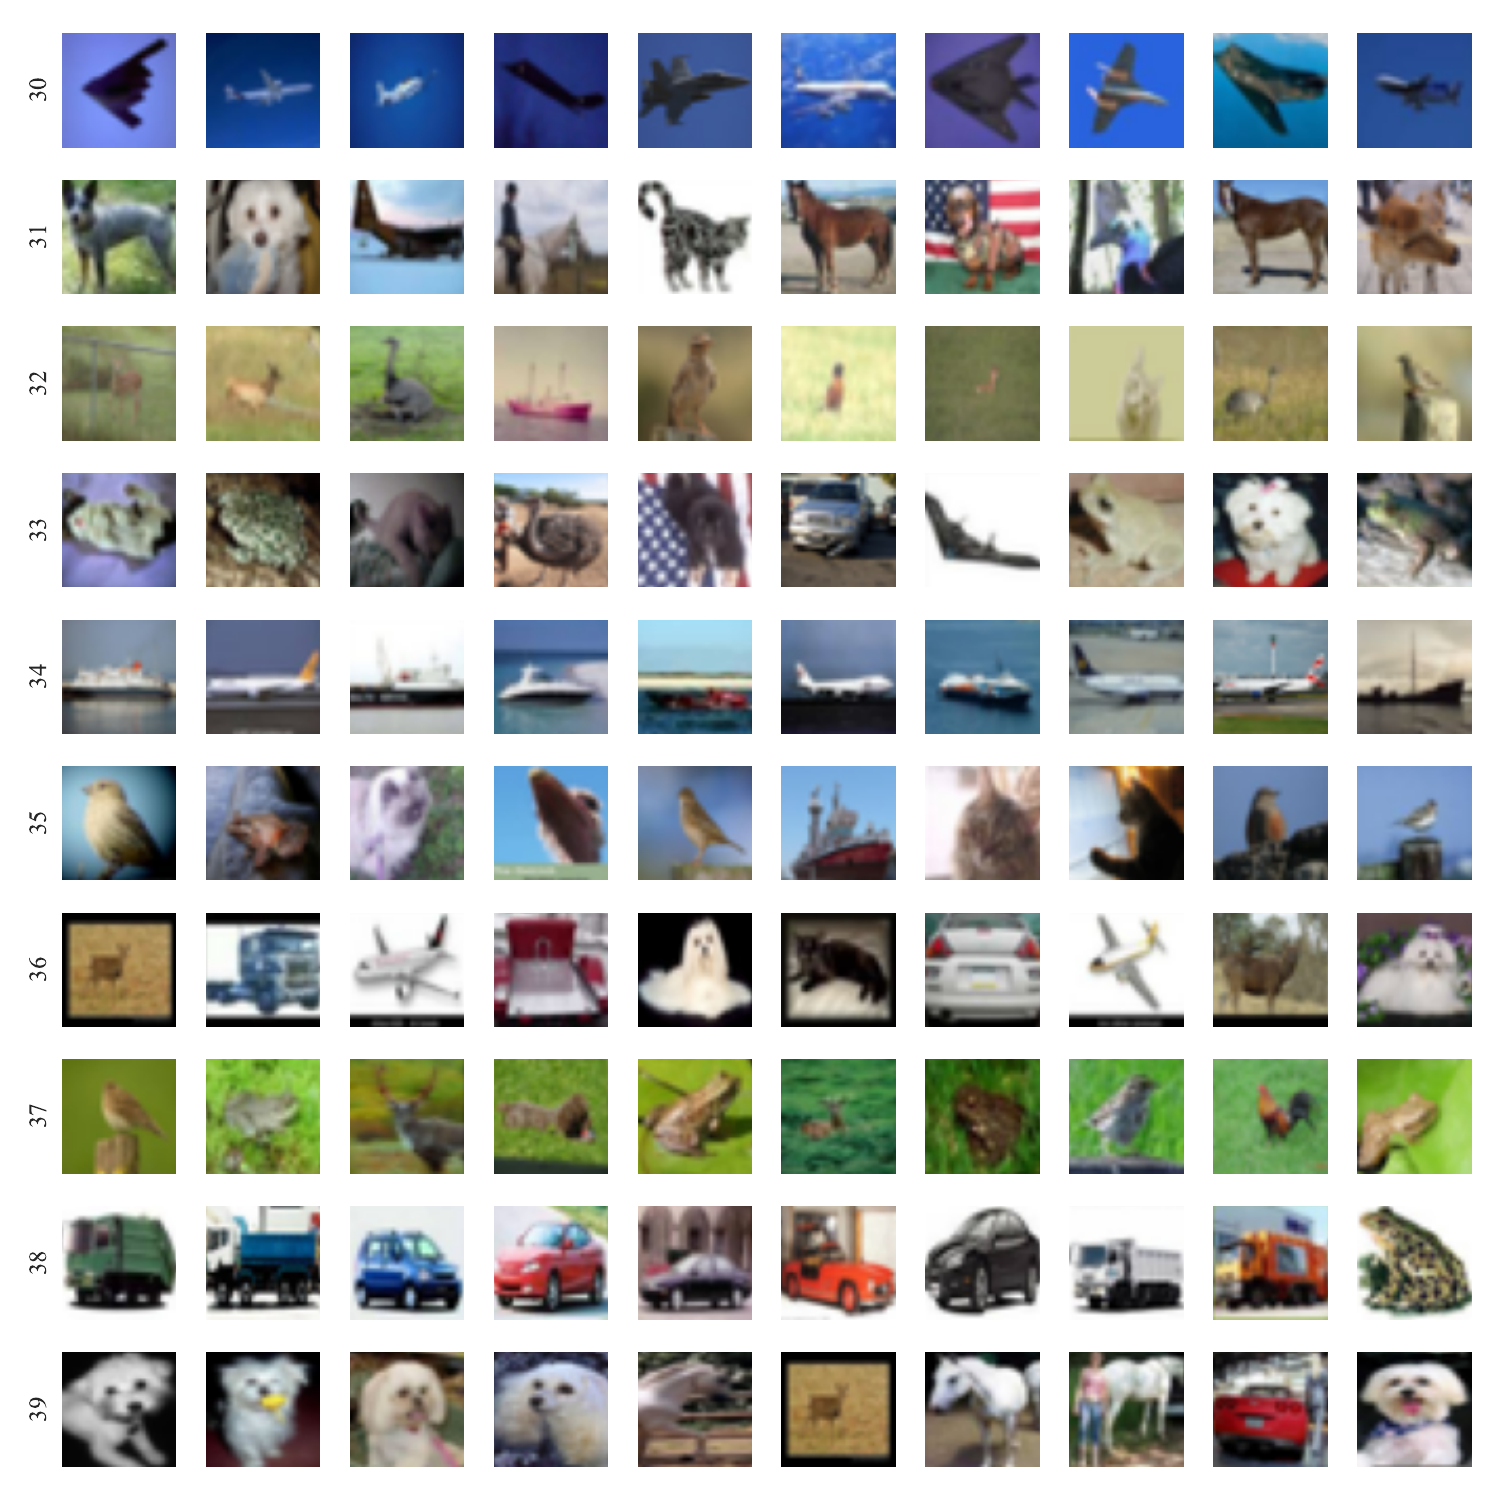
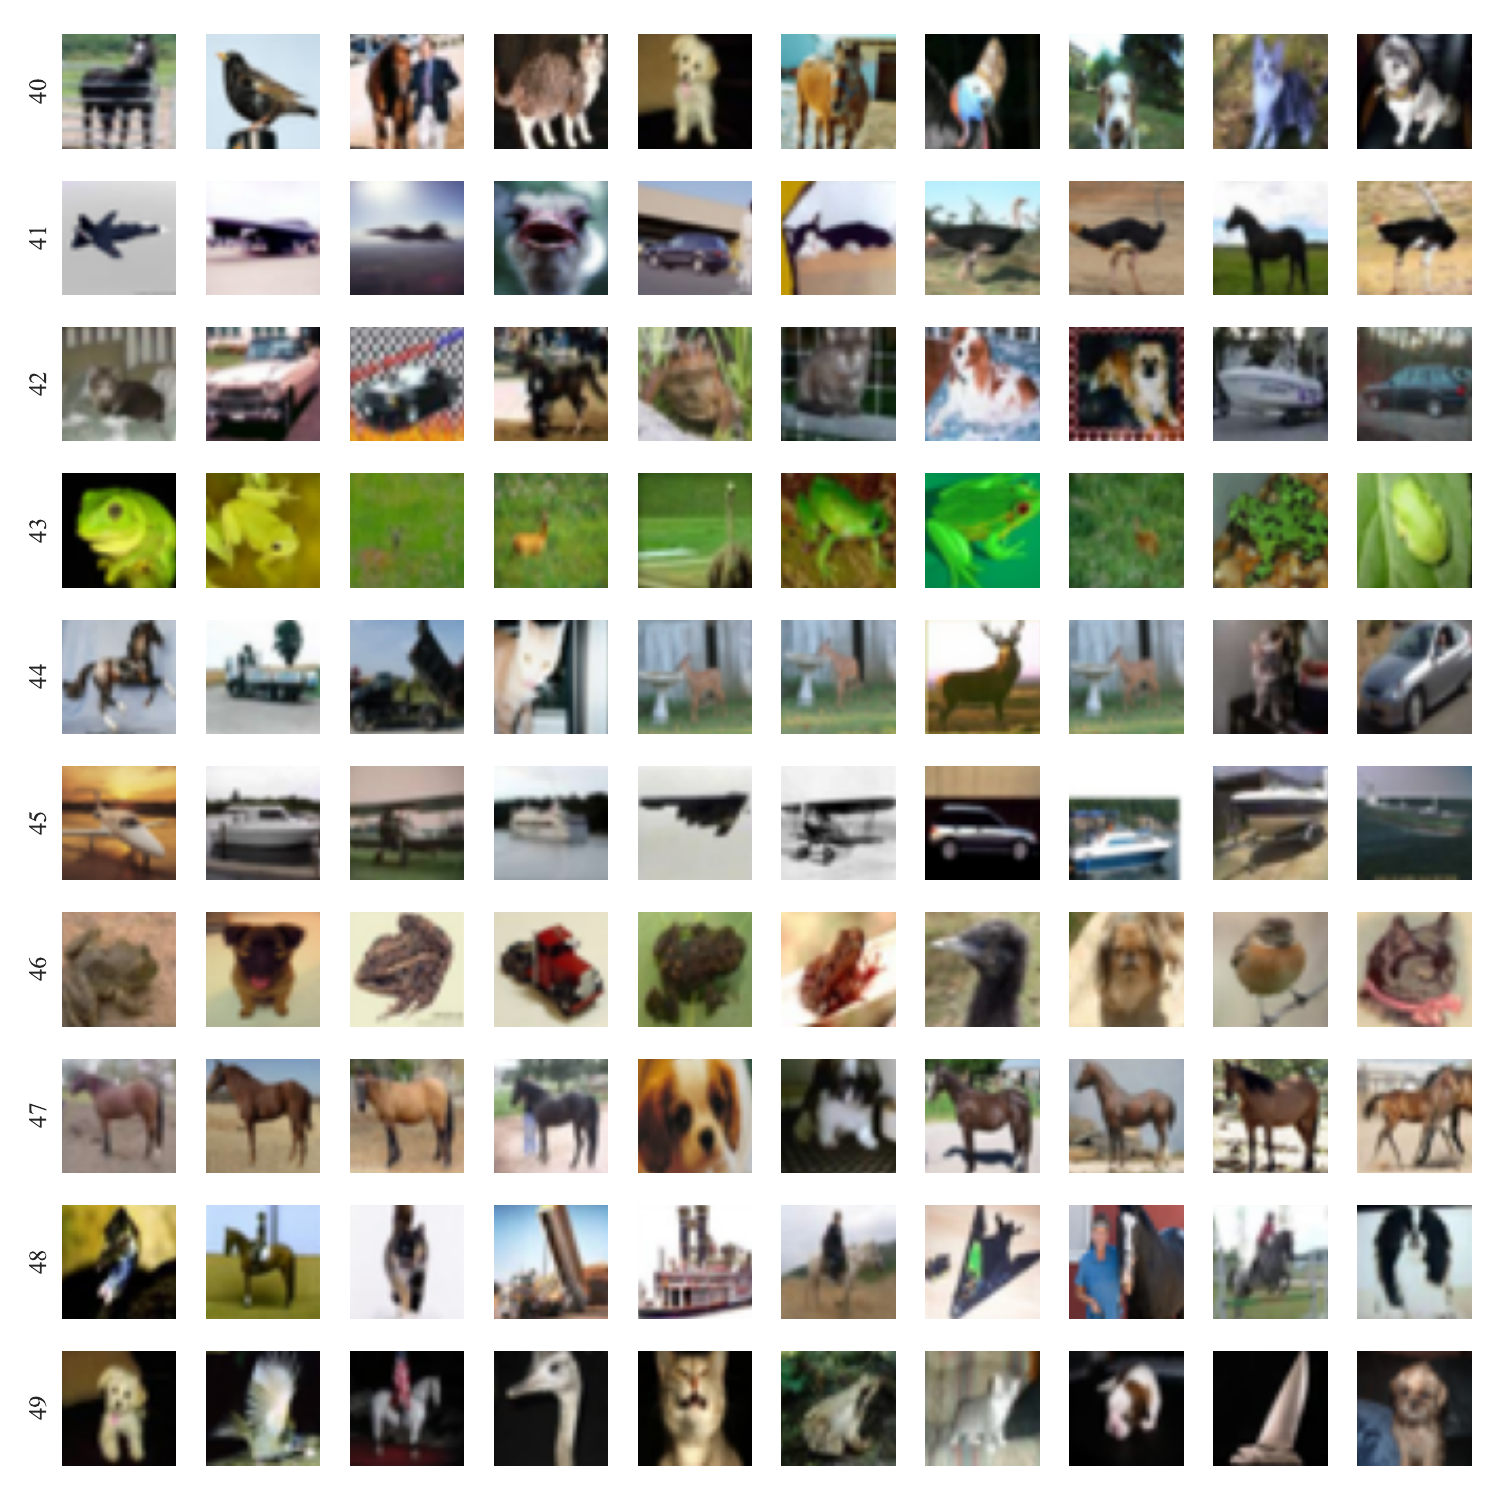
RQ1. Feature Extraction
Figure 4
Example of training data with large weight for some common feature obtained in a dense layer (i.e., deep layer.)
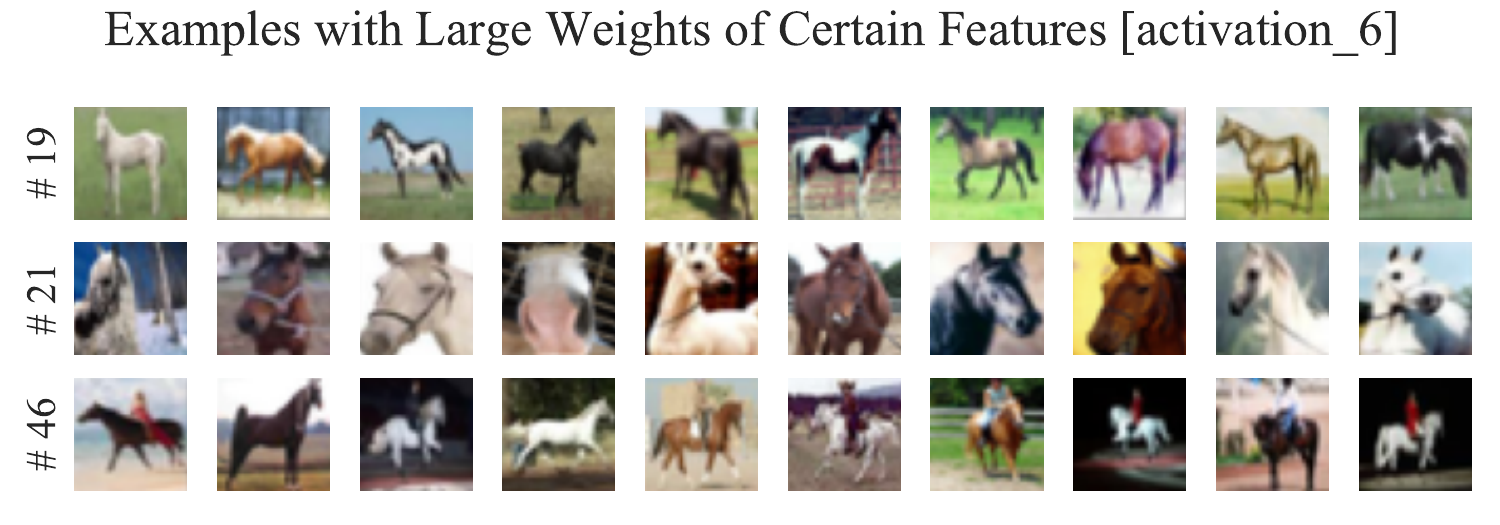
Figure 4’ (Not shown in the paper)
Example of training data with large weight for each common feature obtained in a dense layer (i.e., deep layer.)
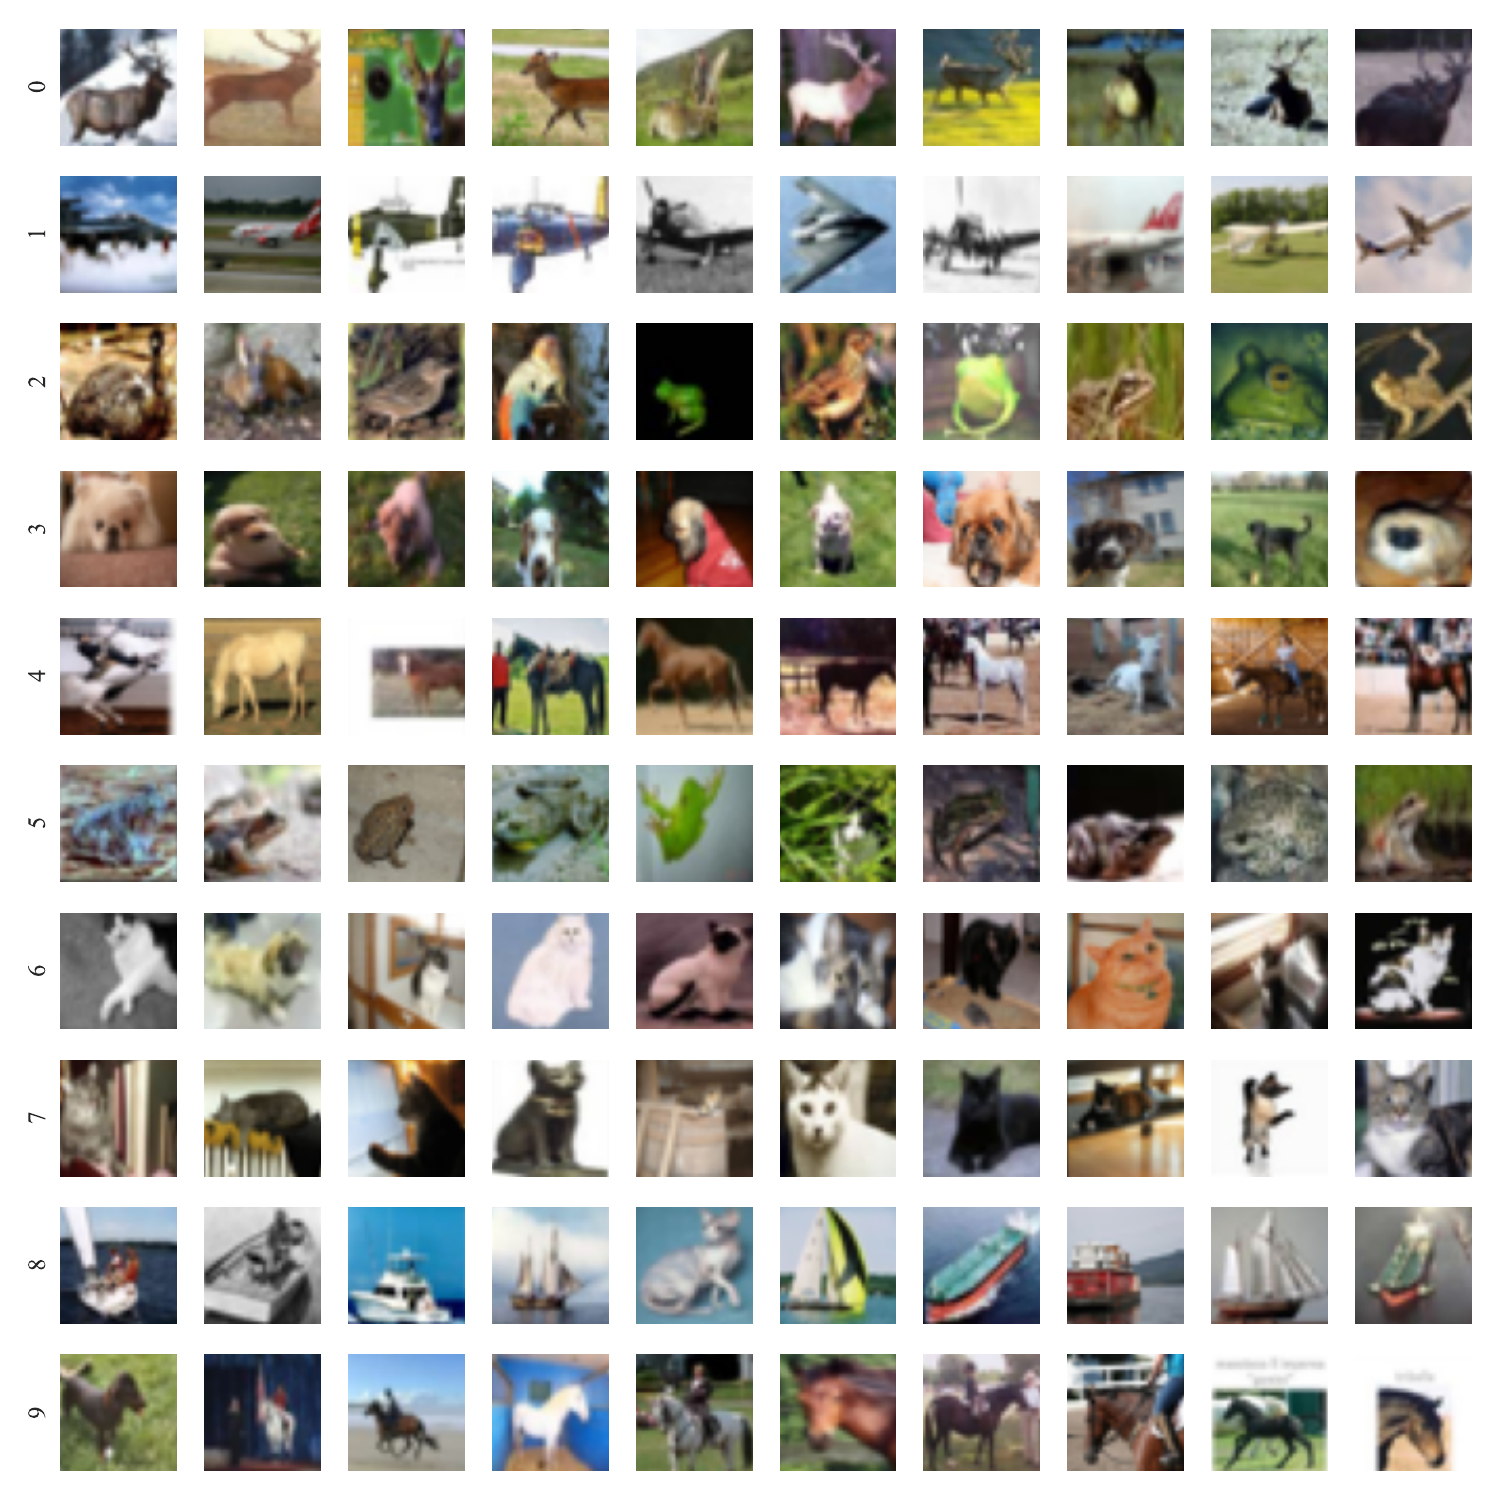

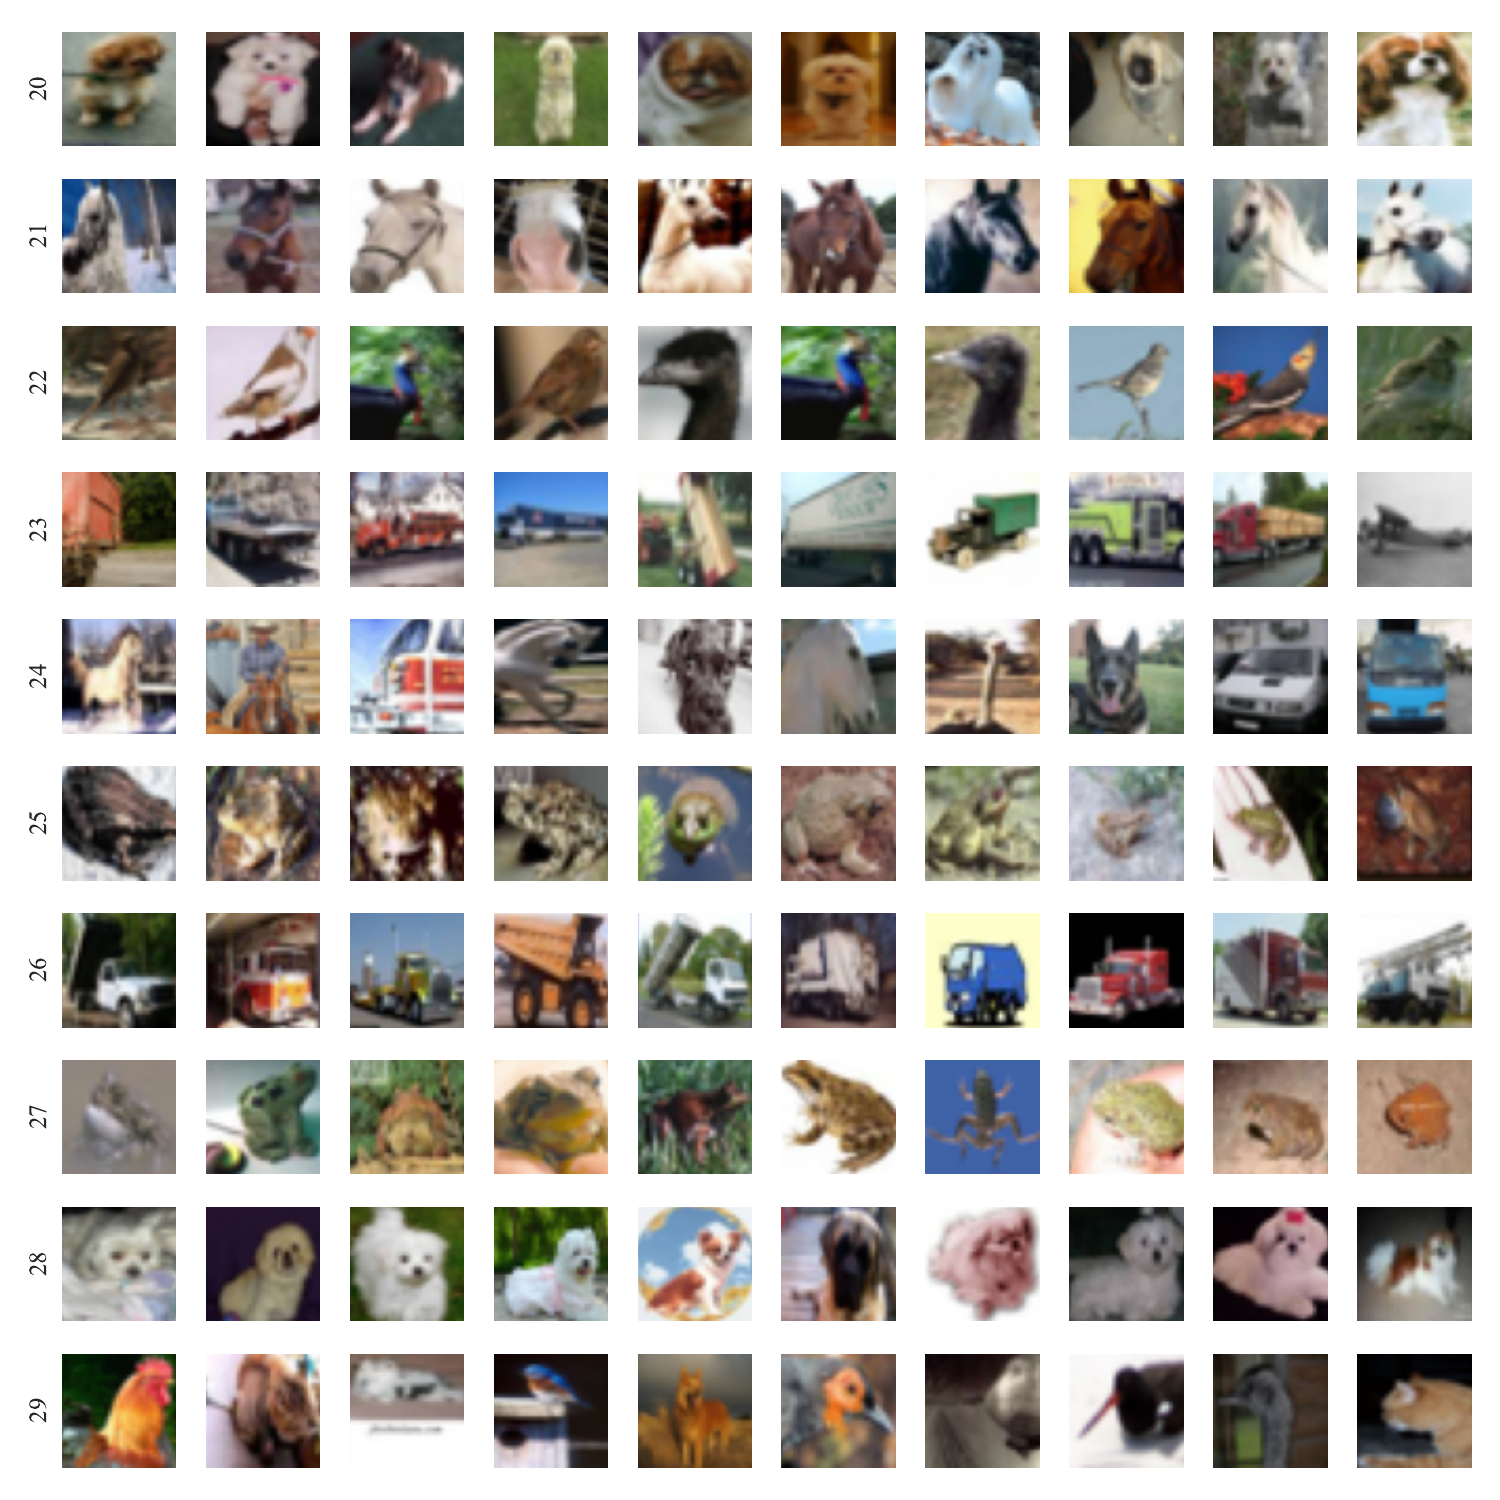
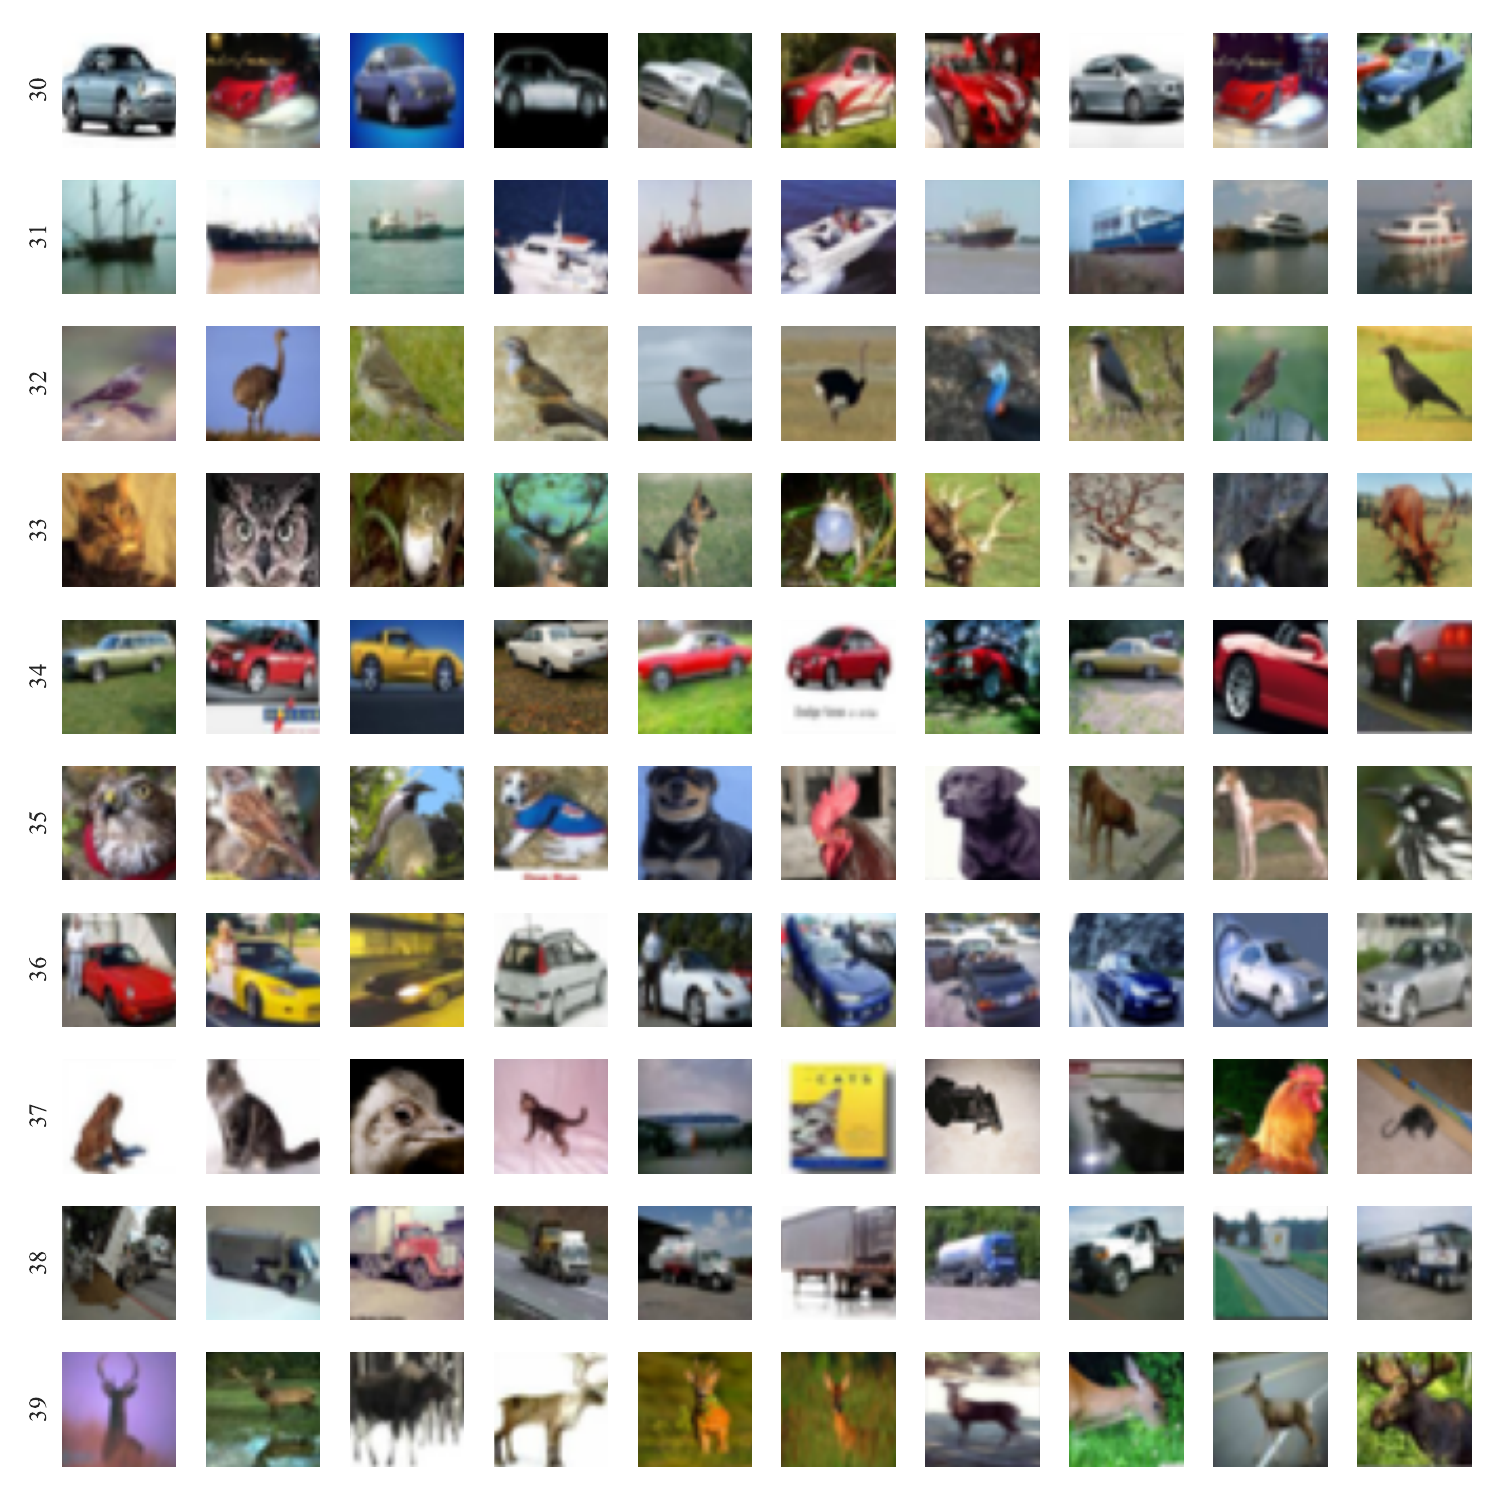

Figure 5
Example of training data with large weight for some common feature obtained in a convolution layer (i.e., shallow layer.)
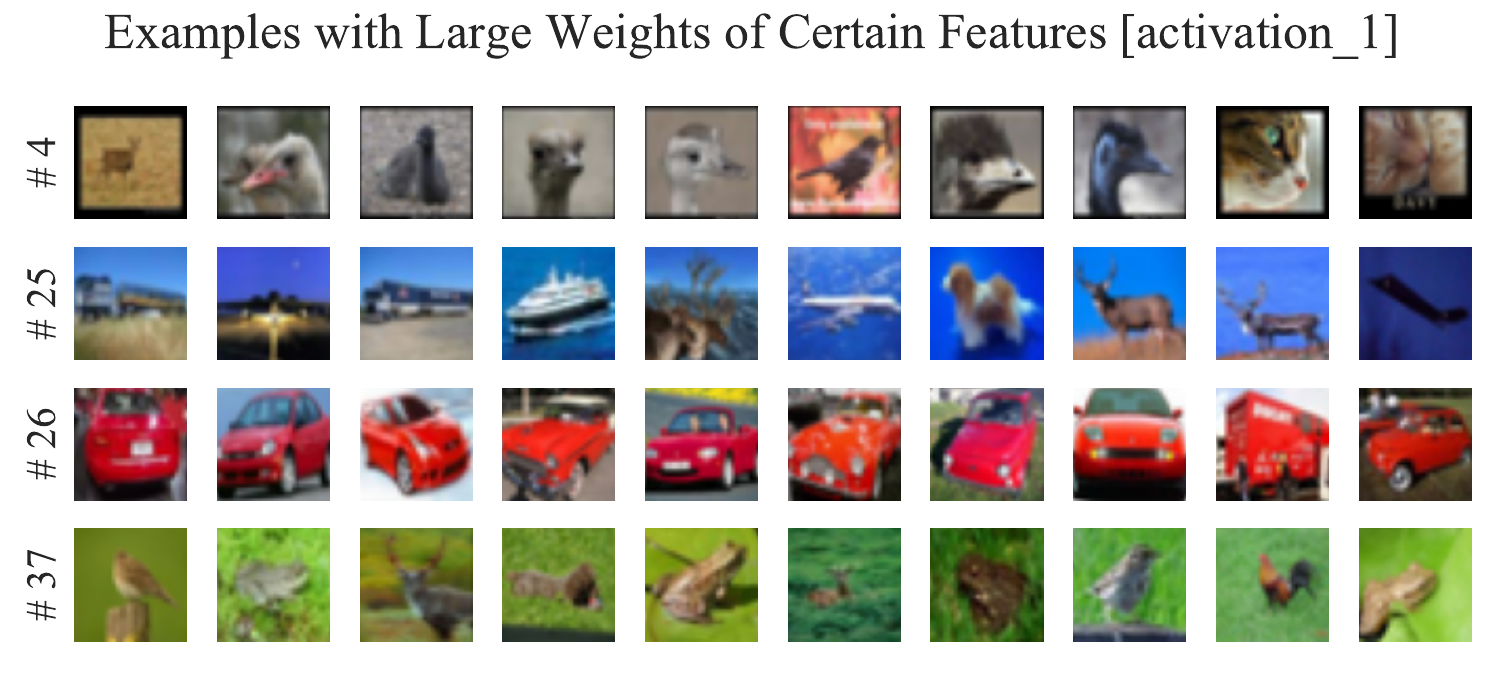
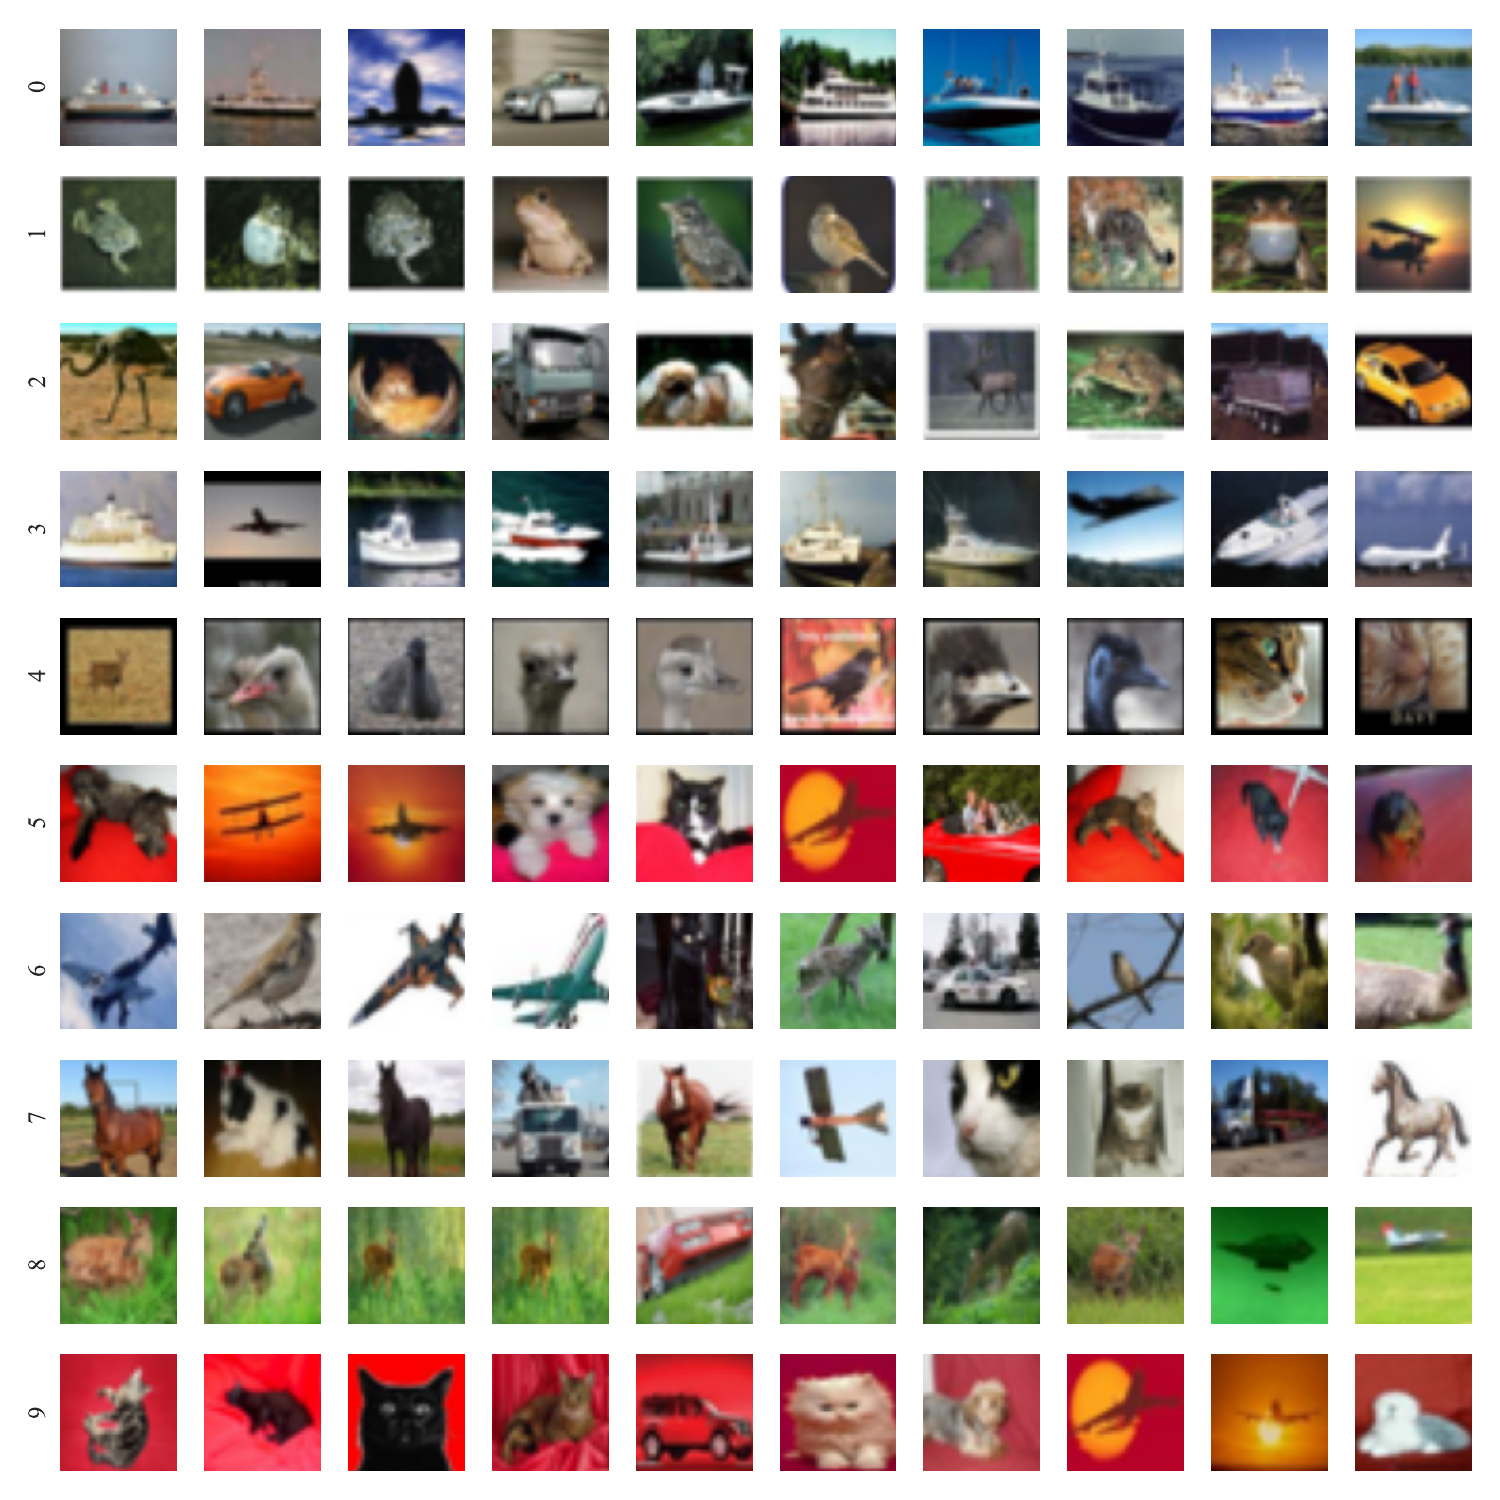
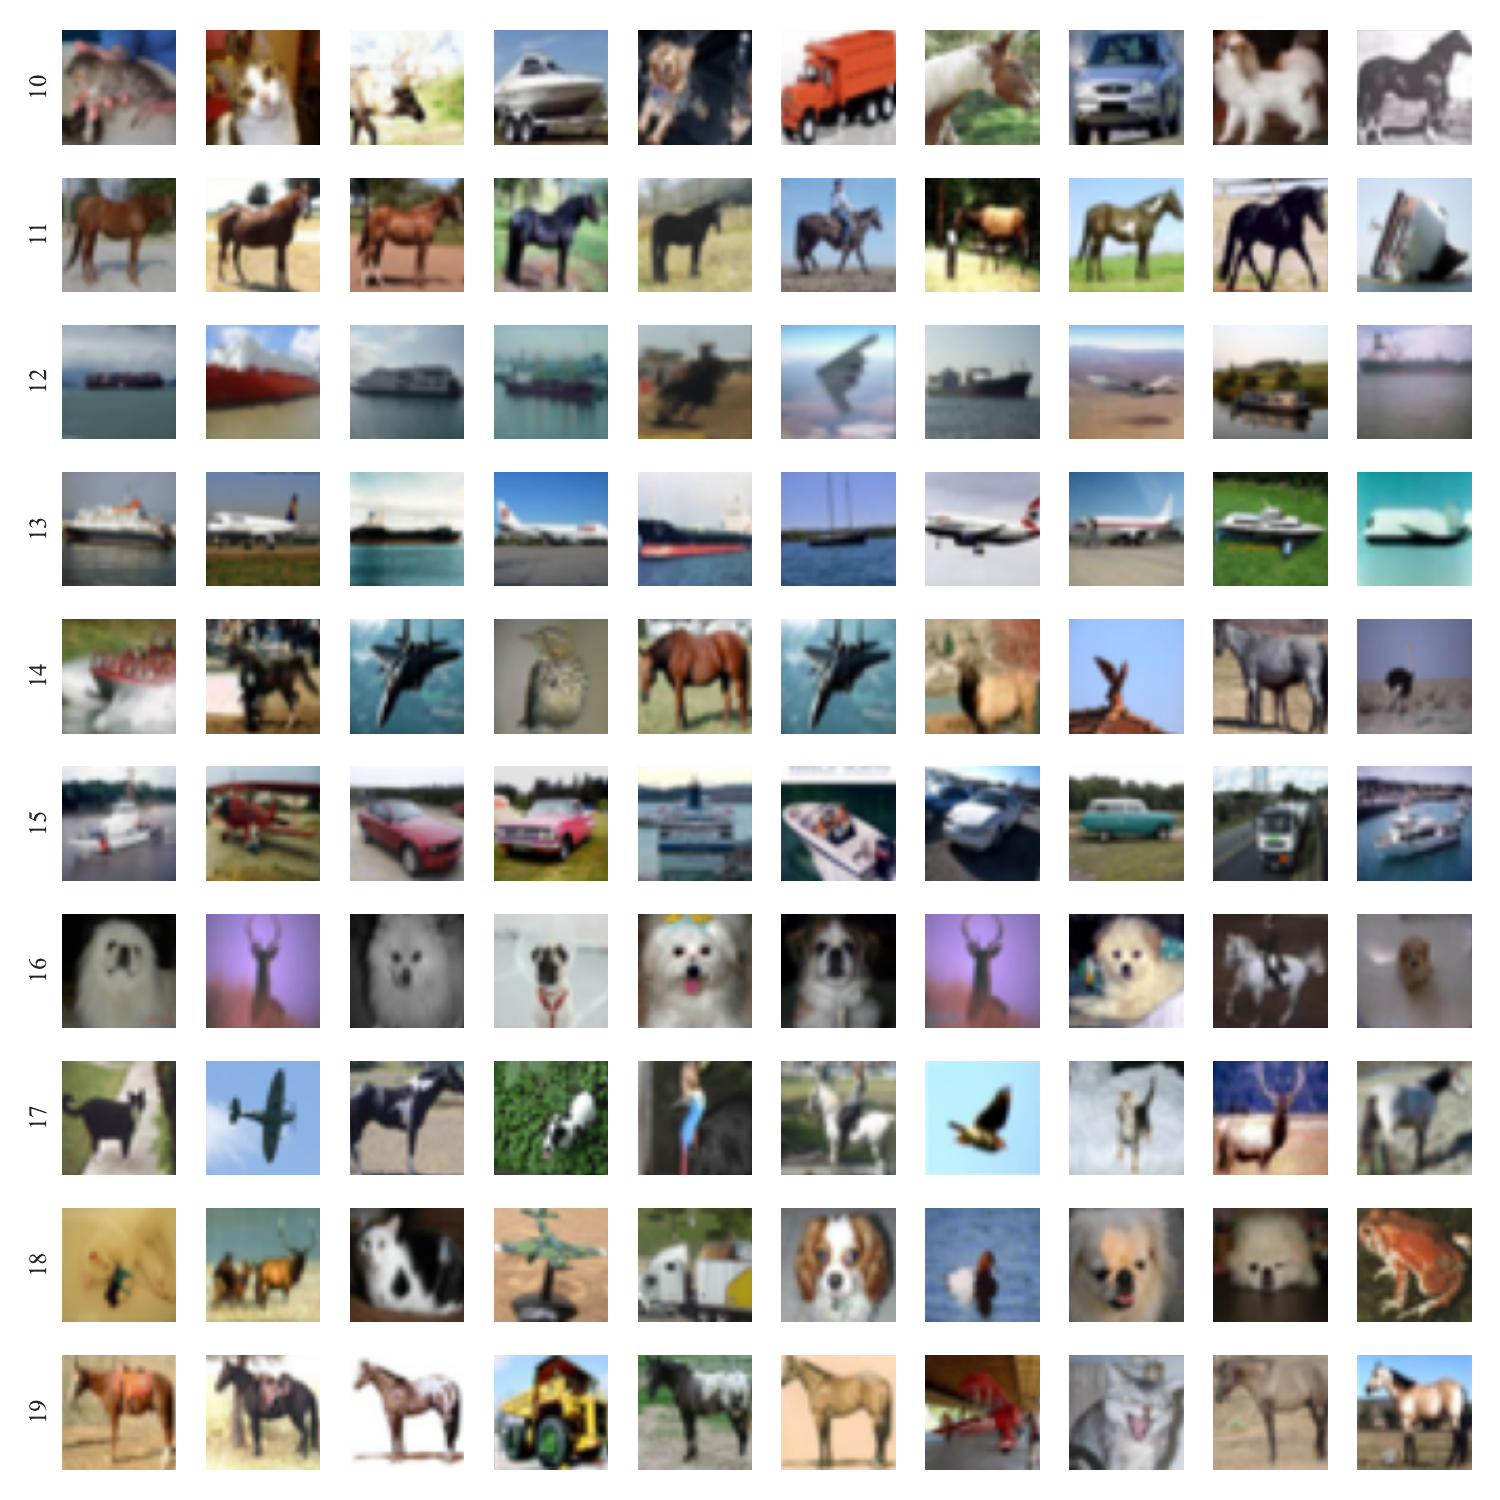
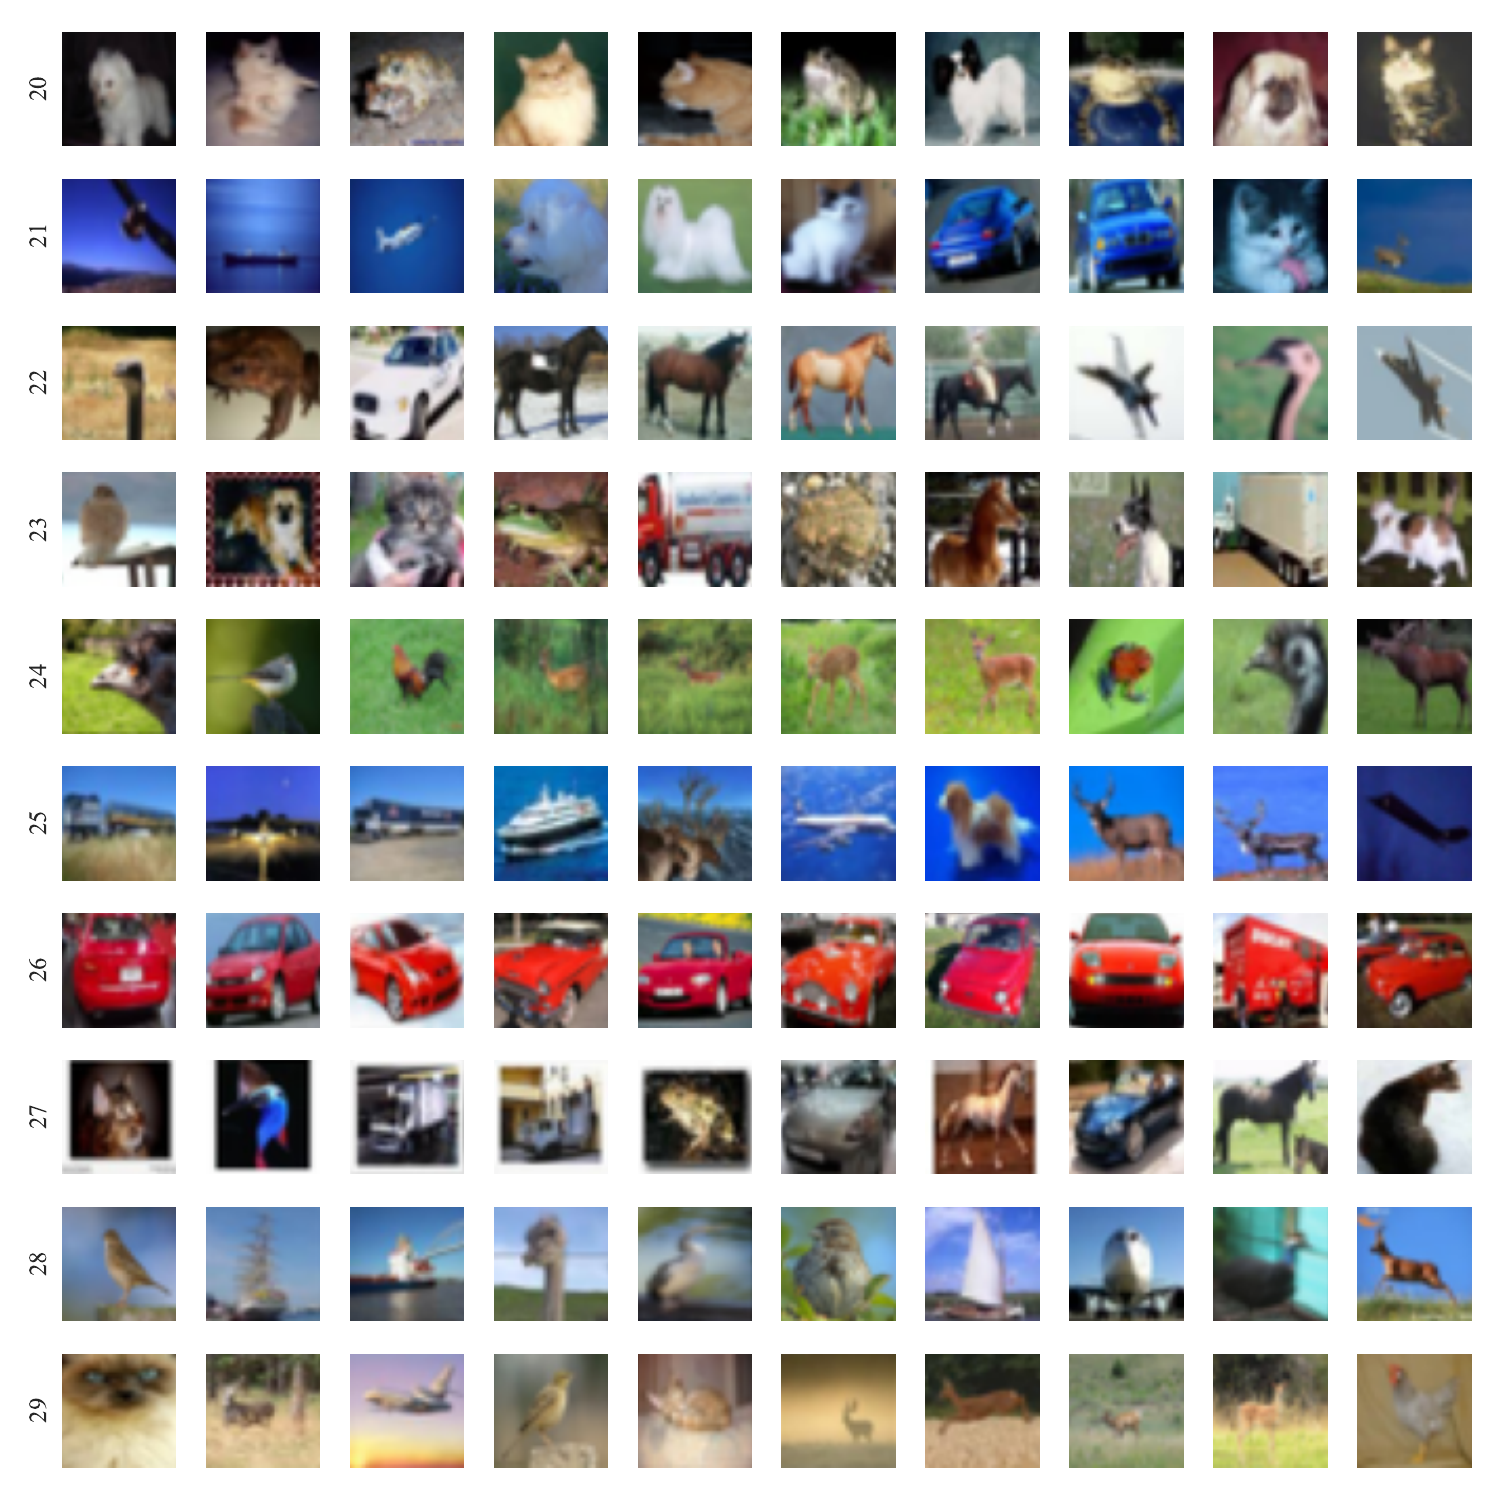
Figure 5’ (Not shown in the paper)
Example of training data with large weight for each common feature obtained in a convolution layer (i.e., shallow layer.)
RQ2.
Figure 6
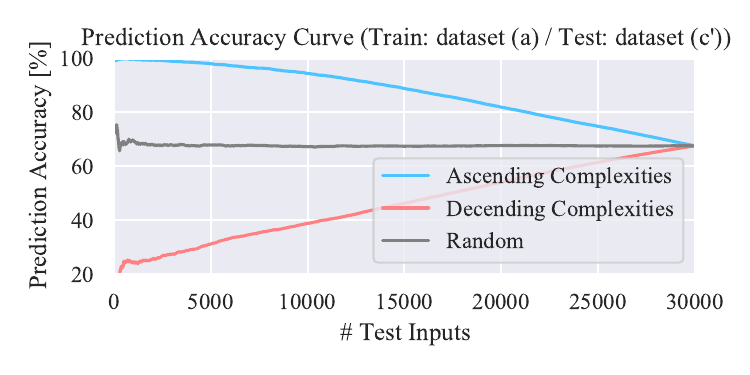
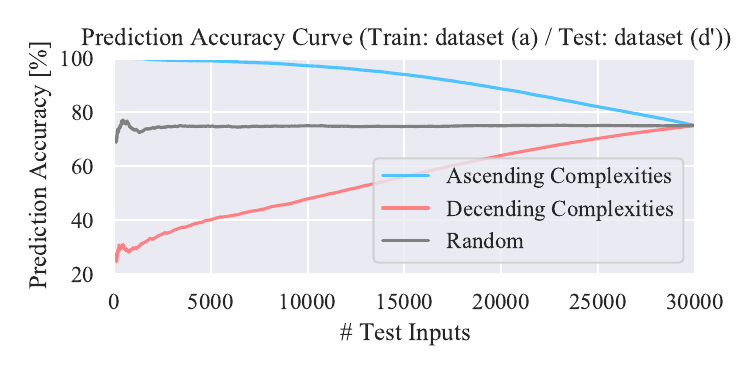
Relationship between prediction accuracy and complexities.
When a model is trained on dataset (a),
as the test data are added in ascending (descending) order of complexities, the prediction accuracy decreases (increases).
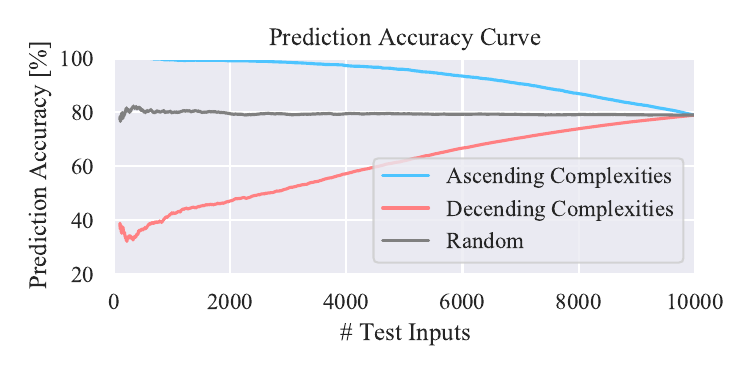
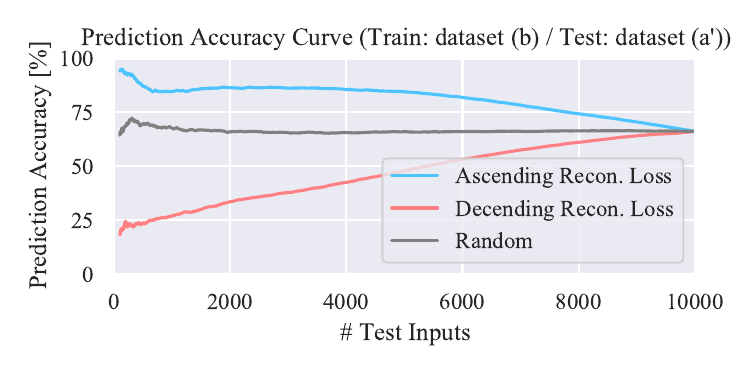
Figure 6’ (Not shown in the paper)
Relationship between prediction accuracy and complexities. We show result with a model trained on dataset (b). We also show results with a model trained on dataset (a) and tested on dataset (c’), (d’), and (e’).
Trained on dataset (b)
Tested on dataset (c’)
Tested on dataset (d’)
Tested on dataset (e’)
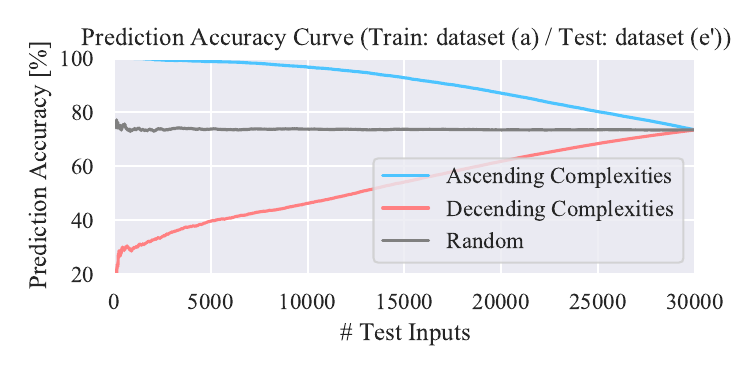
Figure 7
Proportion of labels in test data with top 10% complexities
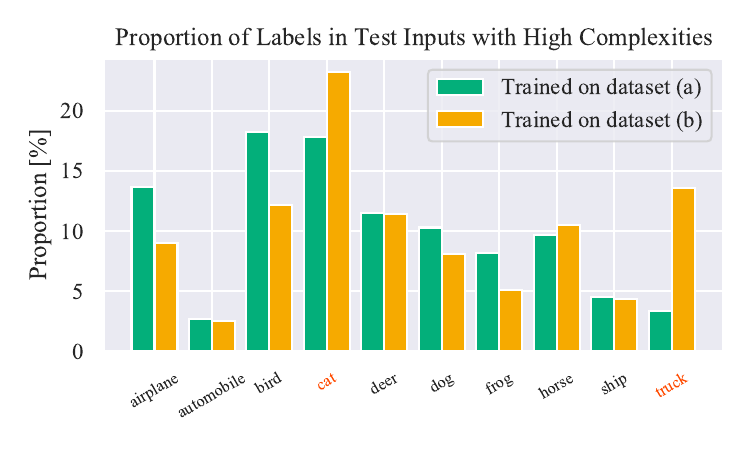
Figure 8
Example of inputs in a training dataset with high complexities.
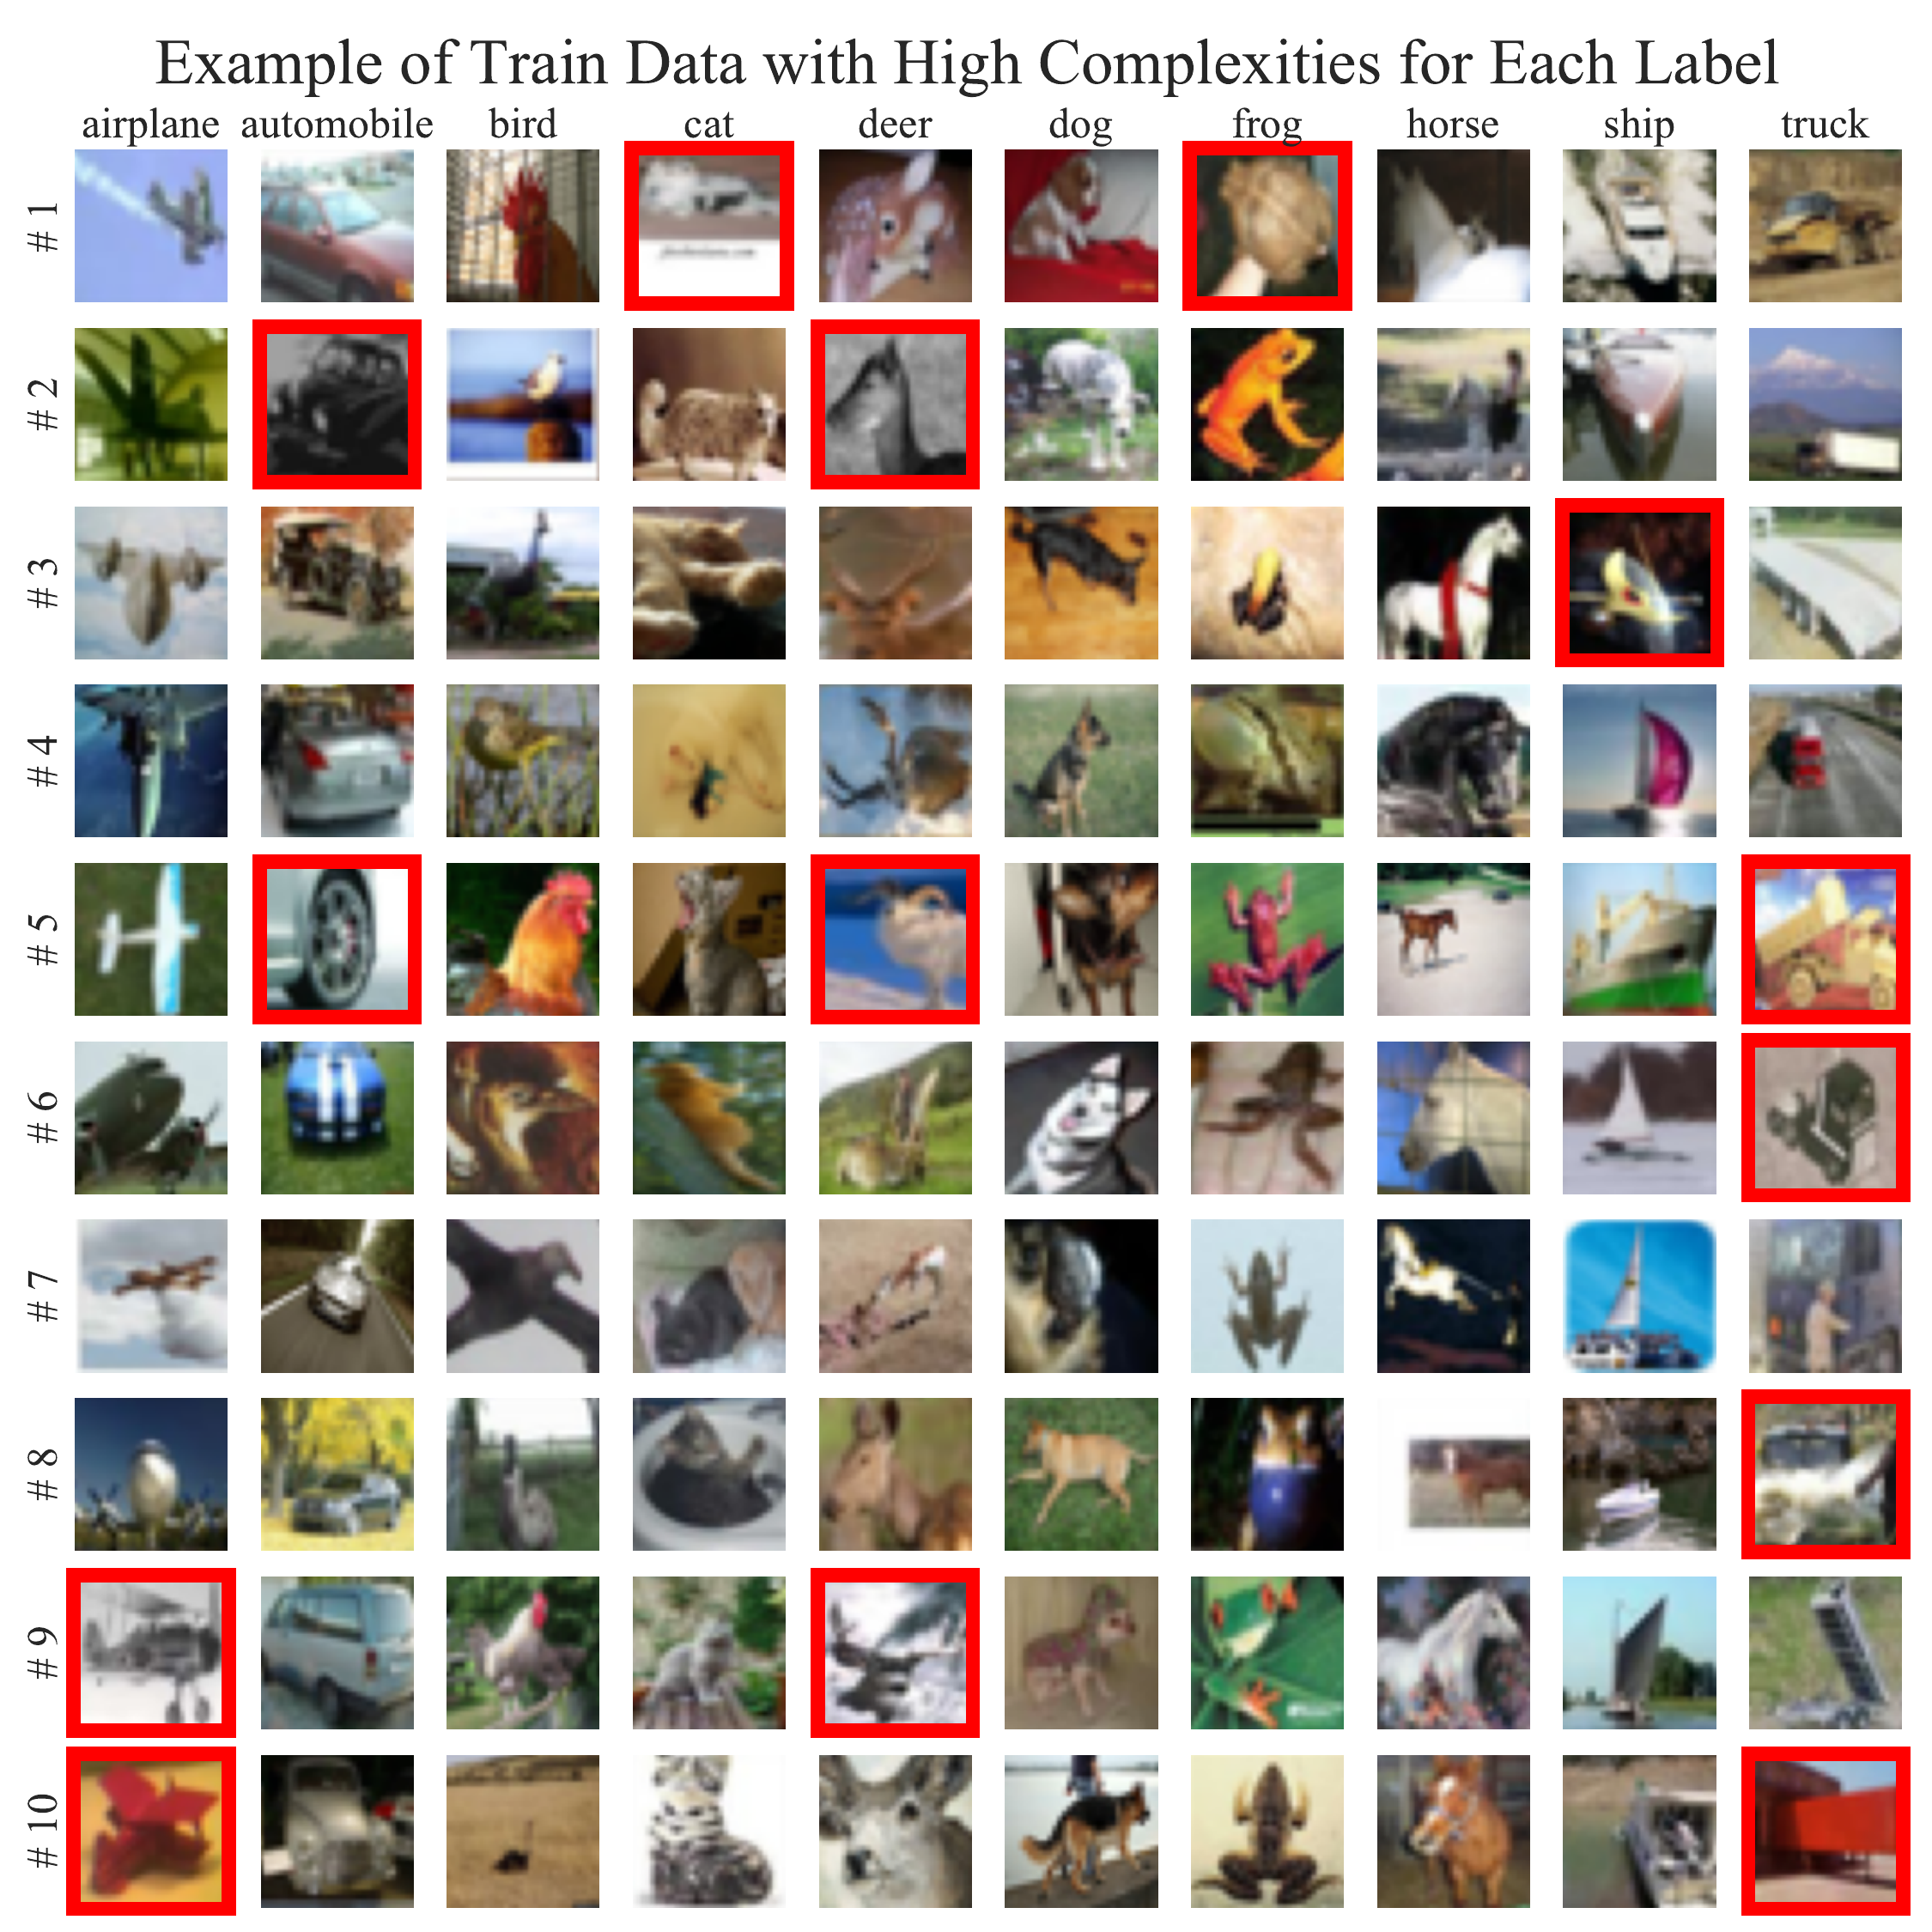
Figure 8’ (Not shown in the paper)
Example of inputs randomly chosen from a training dataset.
Images with red frames indicate suspicious data determined by one of authors.

Figure 10
Histogram of complexities for various inclusion relations between training and test datasets.
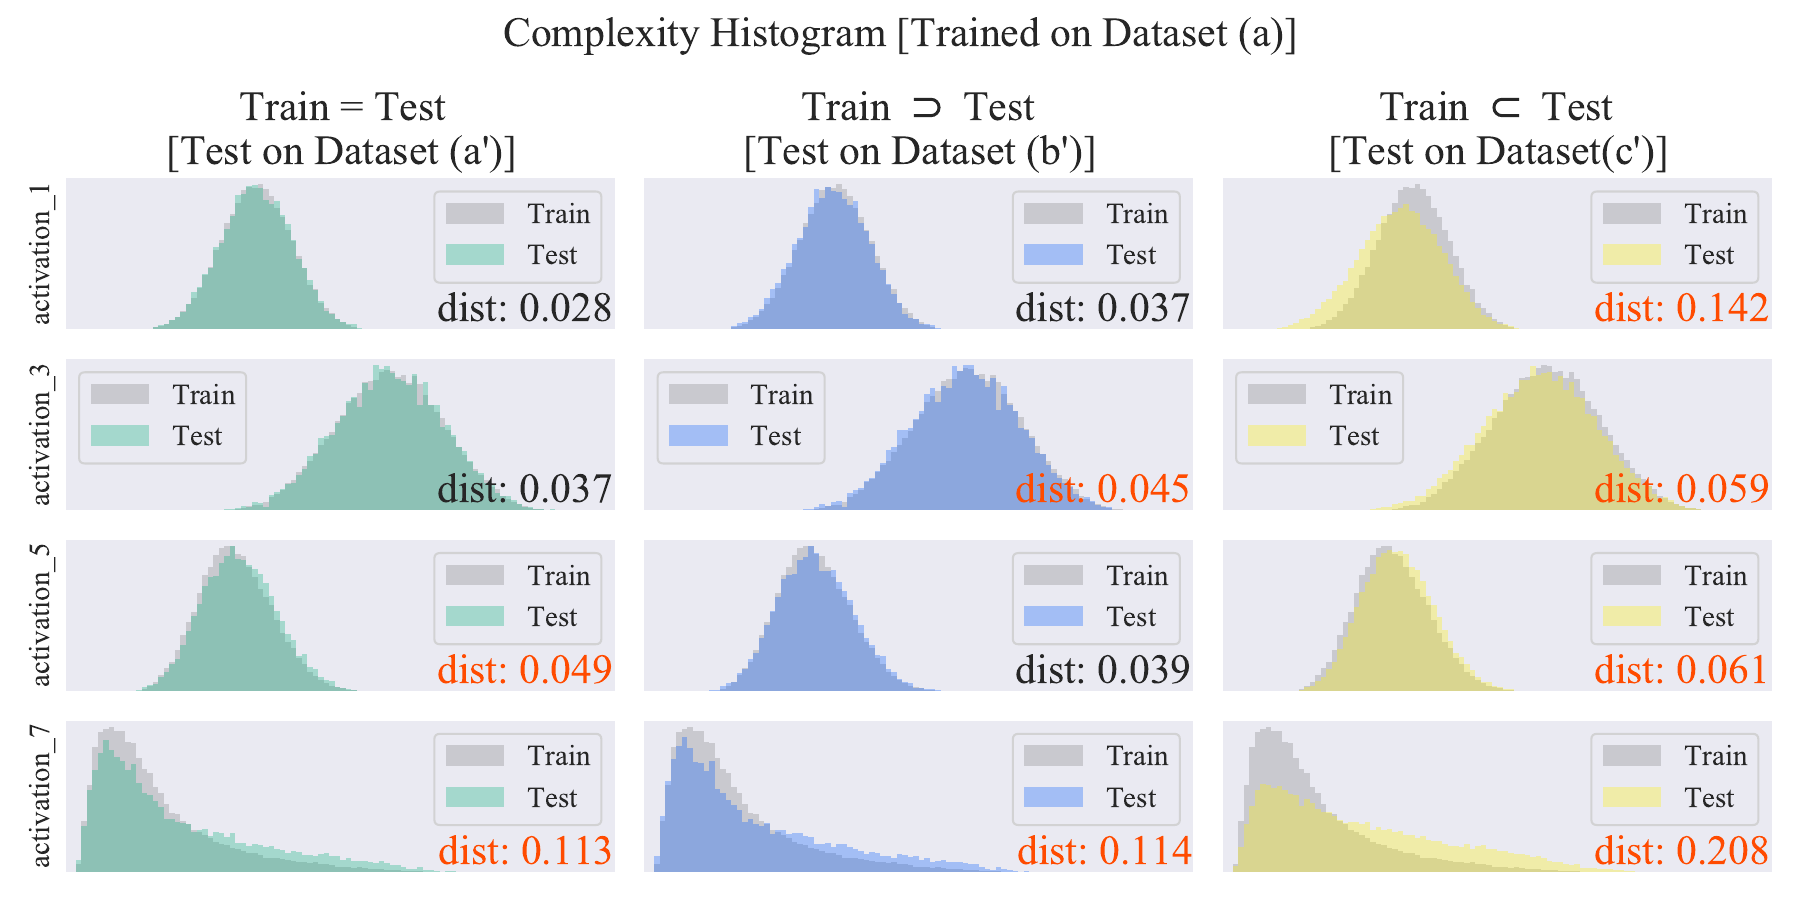
Figure 10’
Histogram of complexities for all layers and test datasets.
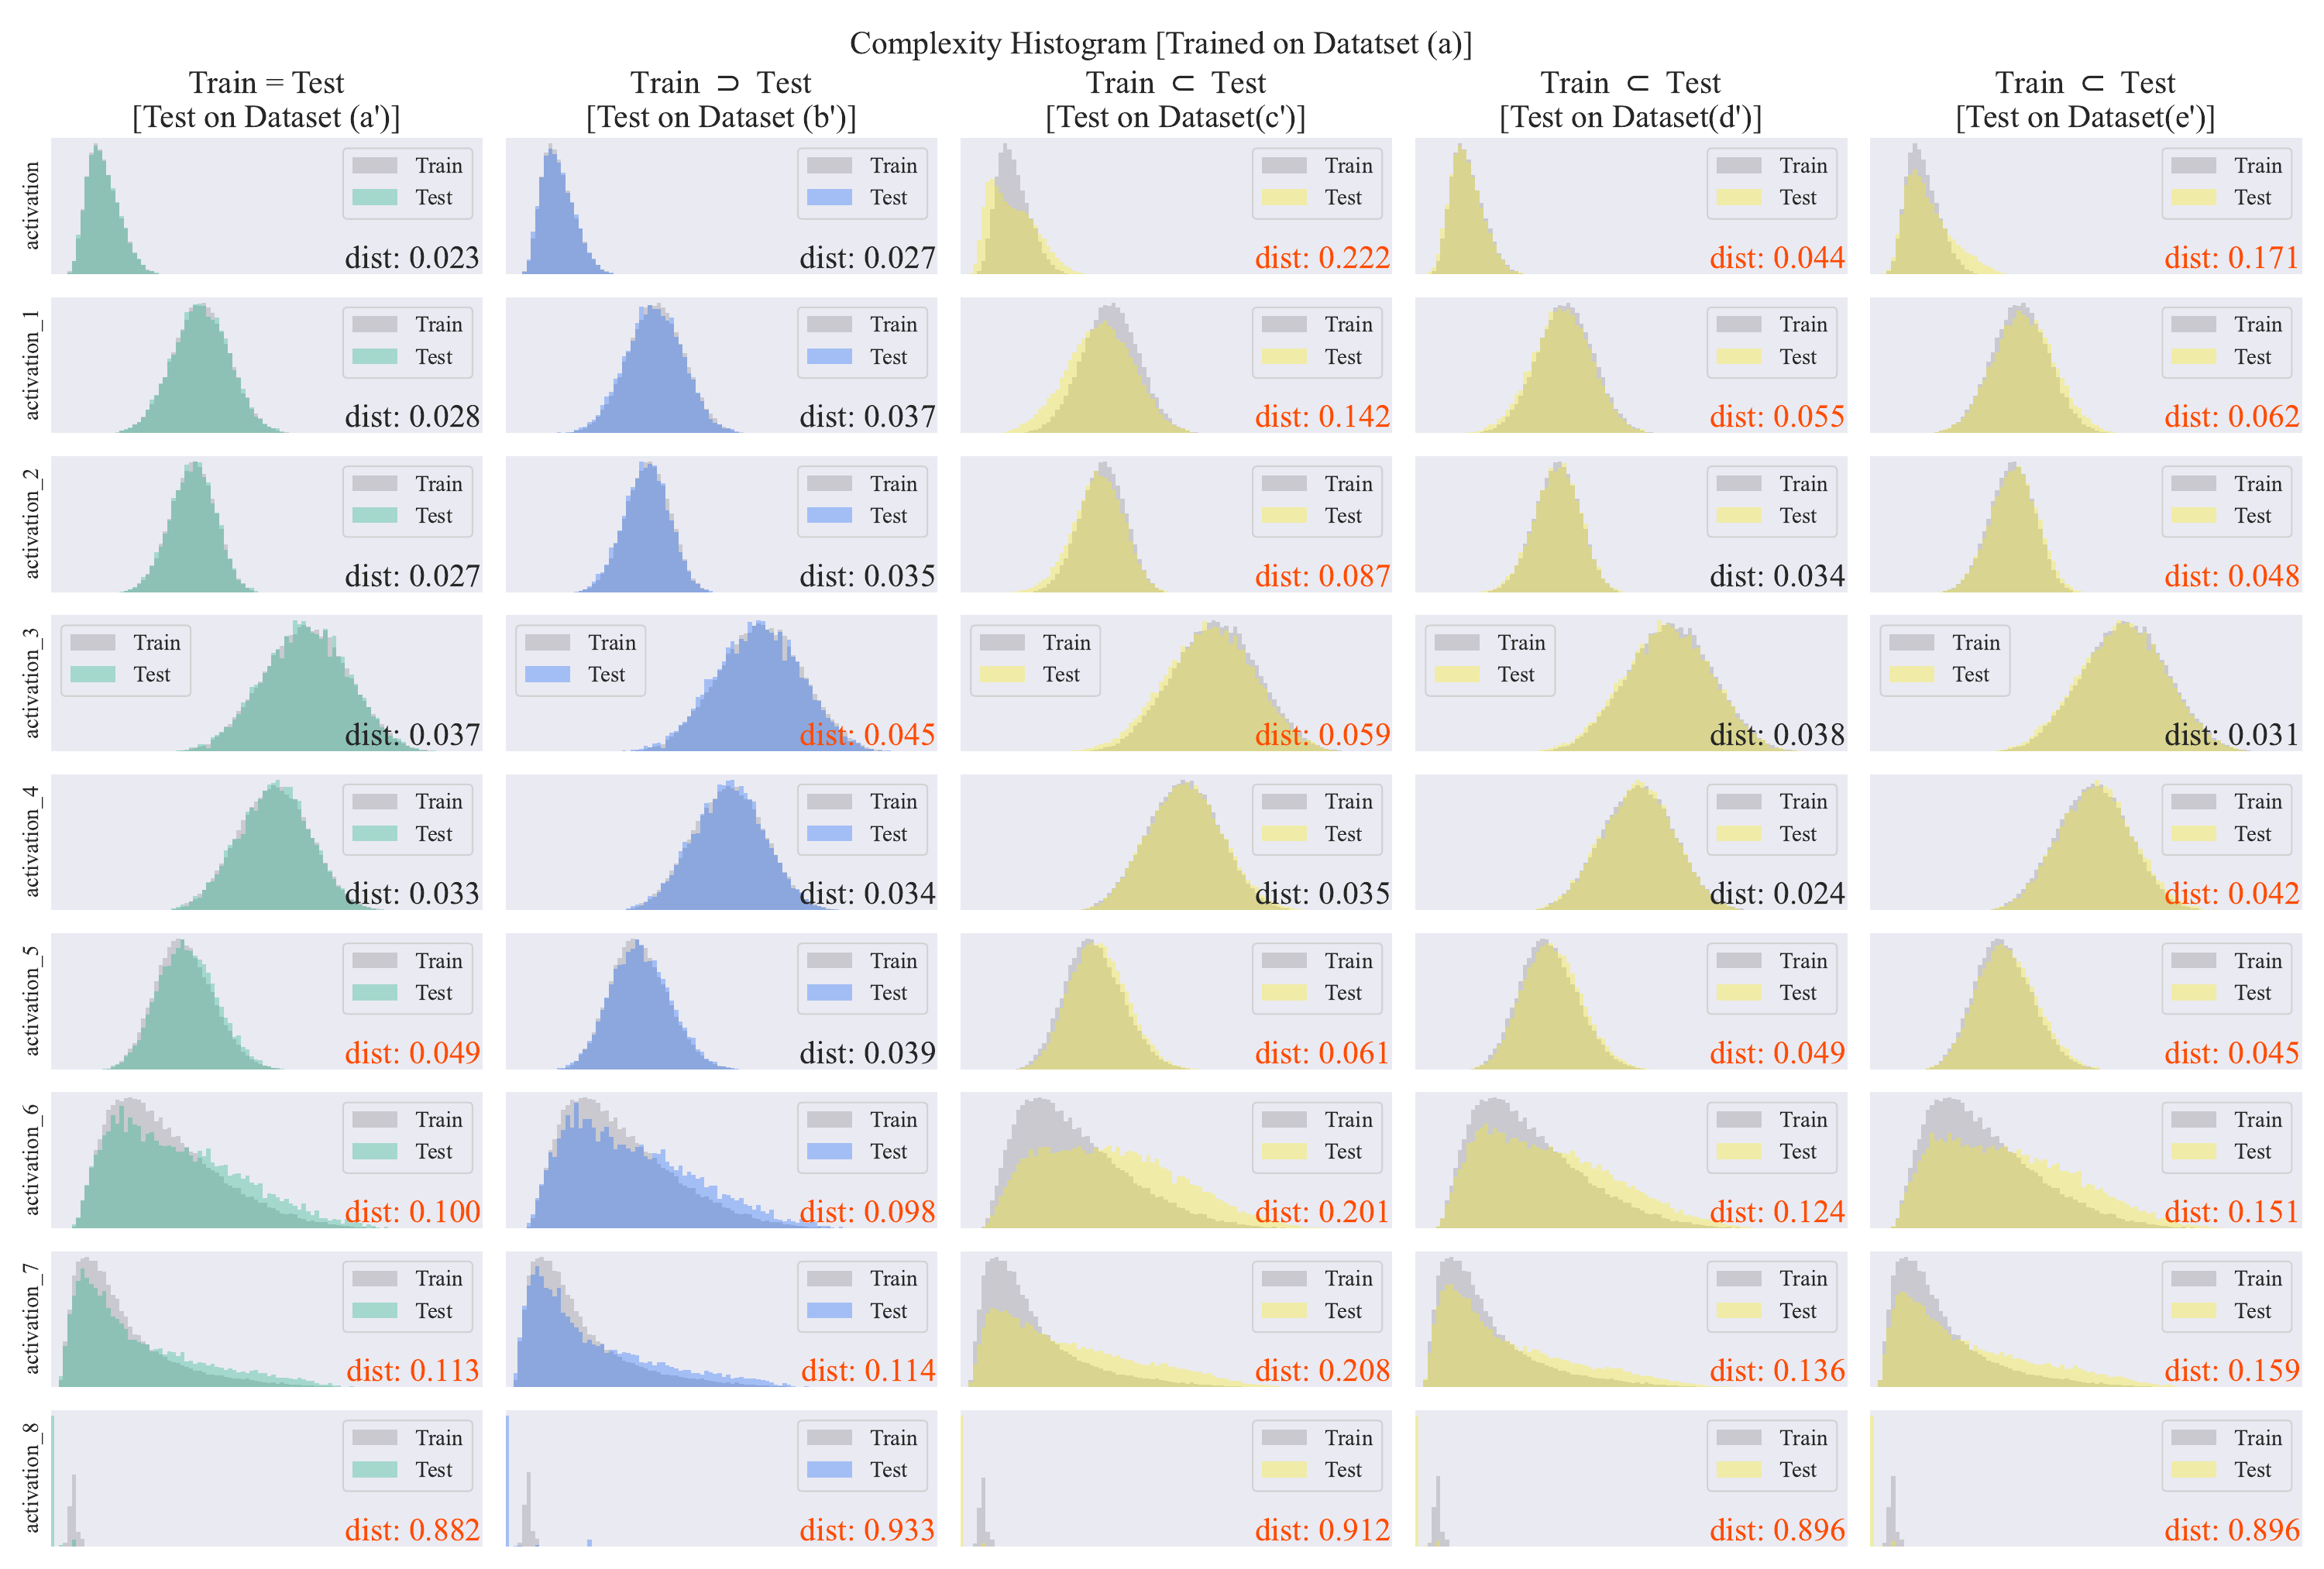
Figure 10’’
Histogram of complexities for various models trained on different training datasets.


